Marketing Analytics Copilot
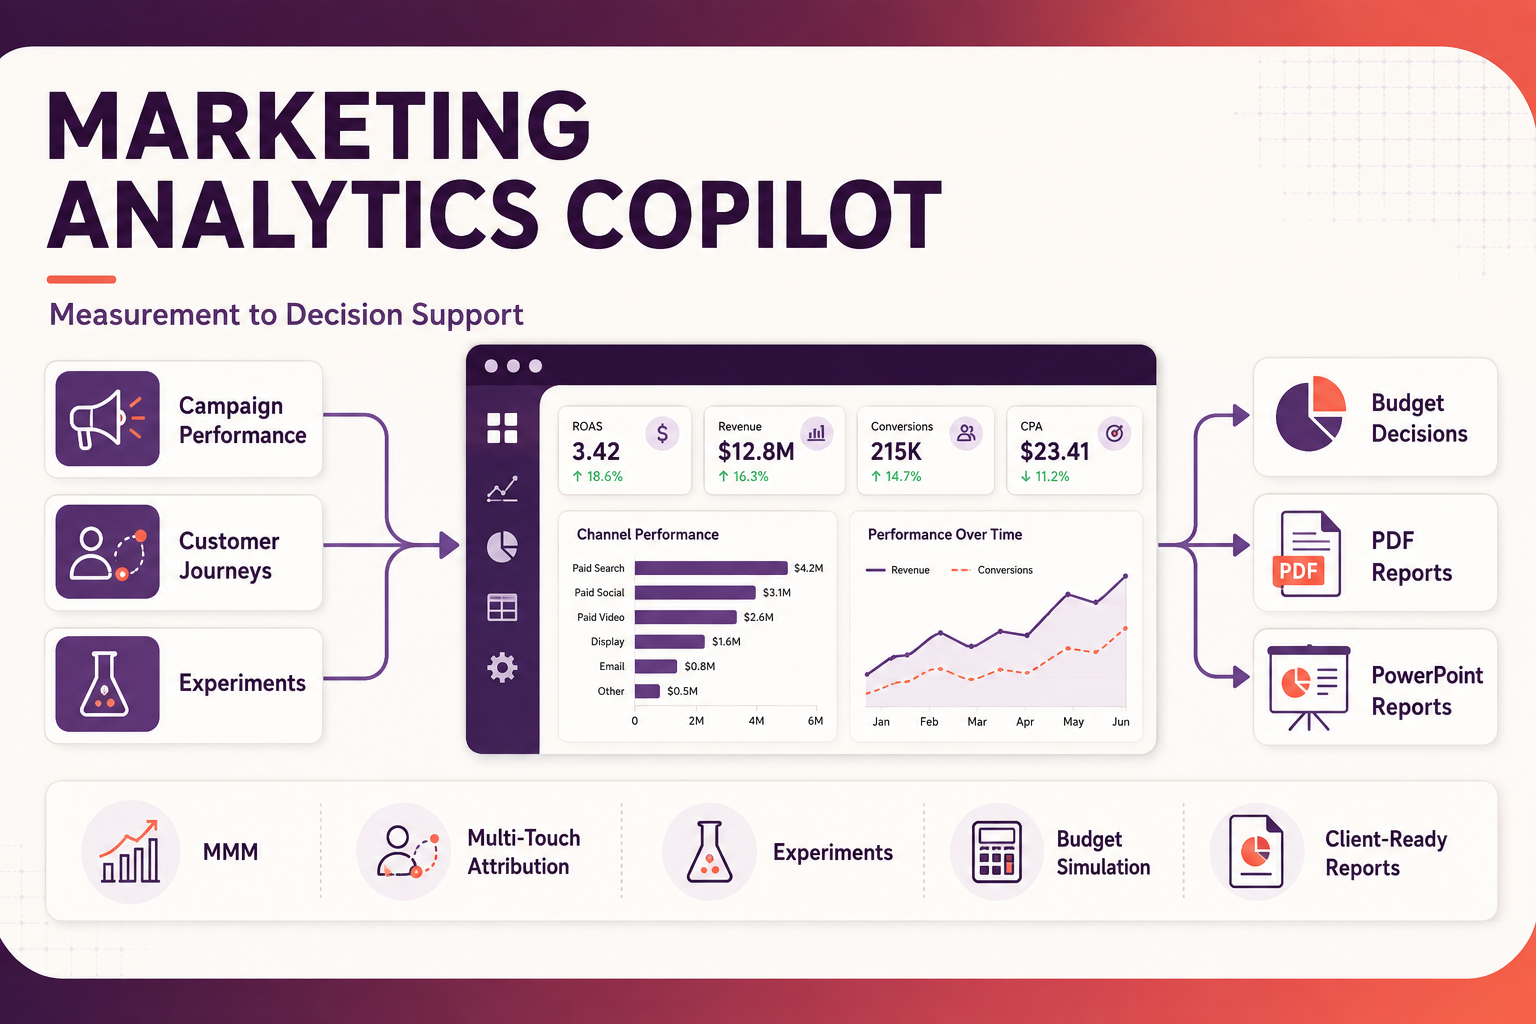
A production-style measurement application that puts marketing mix modeling, multi-touch attribution, experimentation, and budget simulation behind one interface — so a marketing team can answer "where should the next dollar go?" without waiting on an analyst.
Every channel report told a different story.
Marketing teams typically hold three incompatible views of the same spend: platform-reported conversions, a last-touch dashboard, and a quarterly mix model that arrives too late to act on. Each is defensible. Together they stall the decision.
I wanted one place where the methods sit side by side, disagree visibly, and still produce a recommendation someone can take into a budget meeting.
Four layers, one narrative.
Spend, delivery, and conversion diagnostics by channel and campaign — the shared baseline everything else is measured against.
Regression with adstock and saturation transforms to estimate incremental contribution and diminishing returns per channel.
Path-level credit assignment across several models, shown as a comparison rather than a single number — the disagreement is the insight.
Significance testing on live tests, plus a response-curve simulator that reallocates budget and projects the outcome before money moves.
Built to end an argument, not extend it.
The modeling was the easy half. Making three methods disagree legibly — that's what made it usable.
The same pattern shows up in my day job: the analysis is rarely the bottleneck. Getting stakeholders to a shared, defensible view of the trade-off is. This project is where I test interface decisions before they hit real executive reporting.